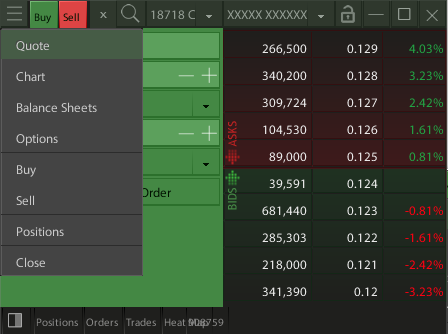
Order Types
Please read below the functionality of each type of command in question
to use and make sure you have no questions about it.
In the Athens and Cyprus Stock Markets, in the final phase of the market,
after the close auction ends, only orders can be entered at the Close.
Τύποι Εντολών:
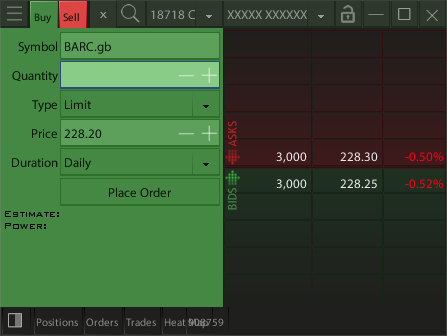
Limit Order
This is the most common type of command. It is the order in which the user enters the price he wishes to buy or sell.
The transaction can be done at a better price if the conditions are met but the worst price will be the limit given by the user.
Market Order
In this command we do not enter a value. The system will execute the order without a price limit depending on the existing supply or demand.
If the supply or demand is exhausted, without completing the quantity of the order, the system will convert it into an order with a Price Limit - Limit Order at the price of the last operation of the order.
Stop Limit
In this order we enter the price limit for our order (Price field) as in the orders with a Price limit, and the activation price of the order in the Stop Price field. The Stop Price is an instruction to the system to wait until the stock price reaches the Stop Price
which we gave and then to enter an order with a Price Limit into the system.
If it is a Sell order the current price of the Share must be above the Stop price (vice versa for a Buy order).
Stop order is useful to limit our losses.
Suppose we have acquired a stock at a price of 10, the current price of the stock is 9.8 and we do not want to lose more than 1, we should put a Sell Stop order with a limit of Price 9 and Stop Price 9.10. This means if the stock falls to 9.10 or below, our sell will be triggered at 9. We have made sure that the Stop Price is somewhat higher than the Ask Price, depending on the liquidity of the stock, so that when our order is triggered there are buyers at this price.
Stop on underline
Stop orders on the underlying concern derivative products,
and are the same as Stop orders with a limit only that the Stop Price is mentioned
in the price of the derivative subject.
at Close
In this command we do not enter a value and they are executed on the closing value of the symbol as it will be configured or has already been configured.
In the Athens and Cyprus Stock markets, in the final phase of the market, after the end of the closing auction, only orders of this type can be entered.
at Open Price
Open price orders wait for the stock to open, the open price to be formed and then be entered as limit orders at the open price.
Often users mistakenly assume that such an order will be executed at all, which is not the case as it is a price limit order.
If it is a Buy order and then the stock moves up, the order will not be executed, as well as it will not be executed if it is a Sell order and the stock moves down after the opening.
After order number...
When in the Duration of an order we select "after the order with number..." our order table appears to choose an order by clicking on its number. The new order that we enter with this option, will be sent to the market after the completion of the selected order. The actual duration of the new order becomes the same as that of the order selected at the time of its entry.
Iceberg
They are orders with a price limit, but they are entered into the market with a quantity equal to the one entered in the Visible Volume field. Once the entire quantity in the market is executed, the system automatically resets the Visible Volume quantity.
This continues until the entire order quantity is used up.
Its advantage is that we can buy or sell a large amount of a stock without it being immediately perceived by market participants.
Its disadvantage is that if there is a large instant supply in the market only the amount of Visible Volume will be executed, and when at a later time our quantity comes back the instant supply may be exhausted.
* Warning regarding the duration of orders in Stock Markets.
It is possible as a result of a corporate action,
your order to be canceled for your protection without notice.
** Warning regarding the duration of orders in the Athens Derivatives Market.
The Derivatives Market of the Athens Stock Exchange now operates with a pre-session,
so the previous issues there were about not being able to cancel
a standing order have been addressed.